Features
| Click to view a larger image of the drawings. | ||
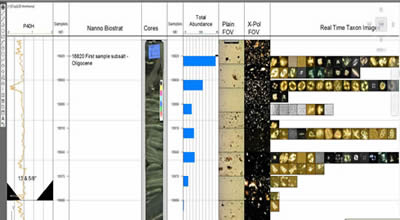 |
Embedded Images Chart BugCAD can automatically embed digital images into your drawing. Simply save the image into a folder with the sample depth included in the filename. In this drawing a conventional core is shown, along with fields of view from the microsope in both plain light and x-pol light. Organic material shows up well in plain light, and calcite illuminates in x-pol. Fossils from each sample are photographed, saved into a folder and listed at the appropriate downhole position on the chart. Click on the image to view a PDF with a zoomable, high resolution version of this drawing. |
|
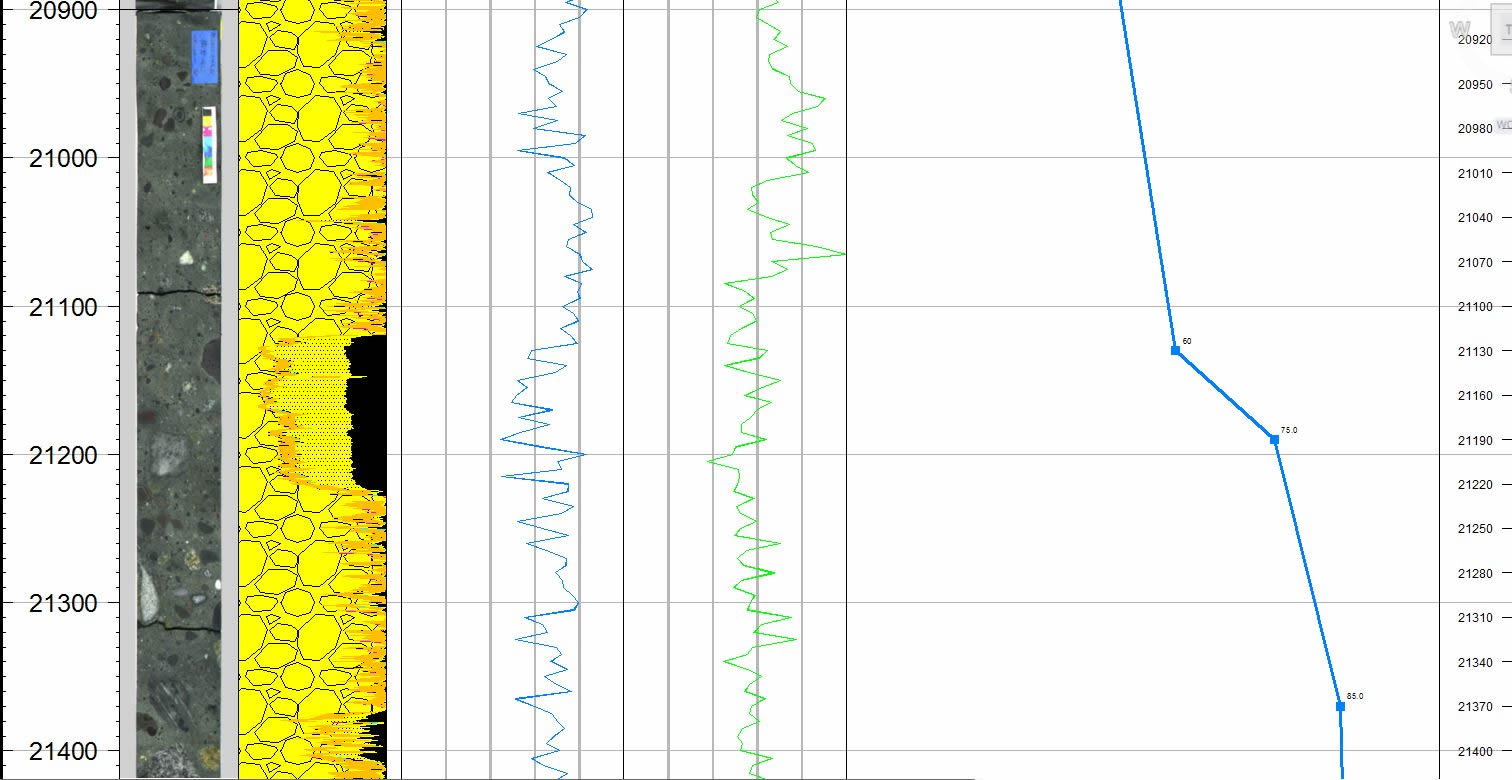 | Time/Depth Plot This chart shows the Time/Depth plot on the right side of the logs. The user can define the color and thickness of the line, the size of the text, and the width of the column. The source file can be the BugWin data file, simply put a line in this format in each sample that you have an age change: Ma: 12.7 | |
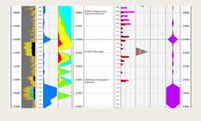
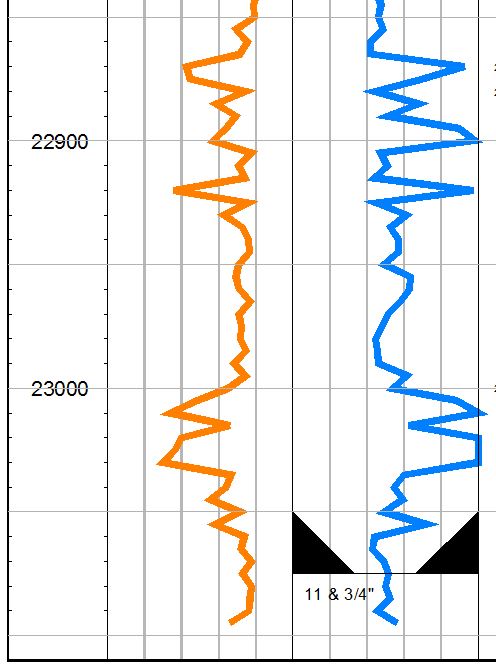
 | Various Curves This is a section of a typical chart showing a variety of features. From left to right: scale column, graphical lithology, sample list, total abundance column (blue), compact multiple curve, scale column, sample list, taxon abundance with two different fossils superimposed, sawtooth style taxon curve, butterfly style taxon curve, and finally a scale column. The user can put an unlimited number of columns of any type, in any order. | |
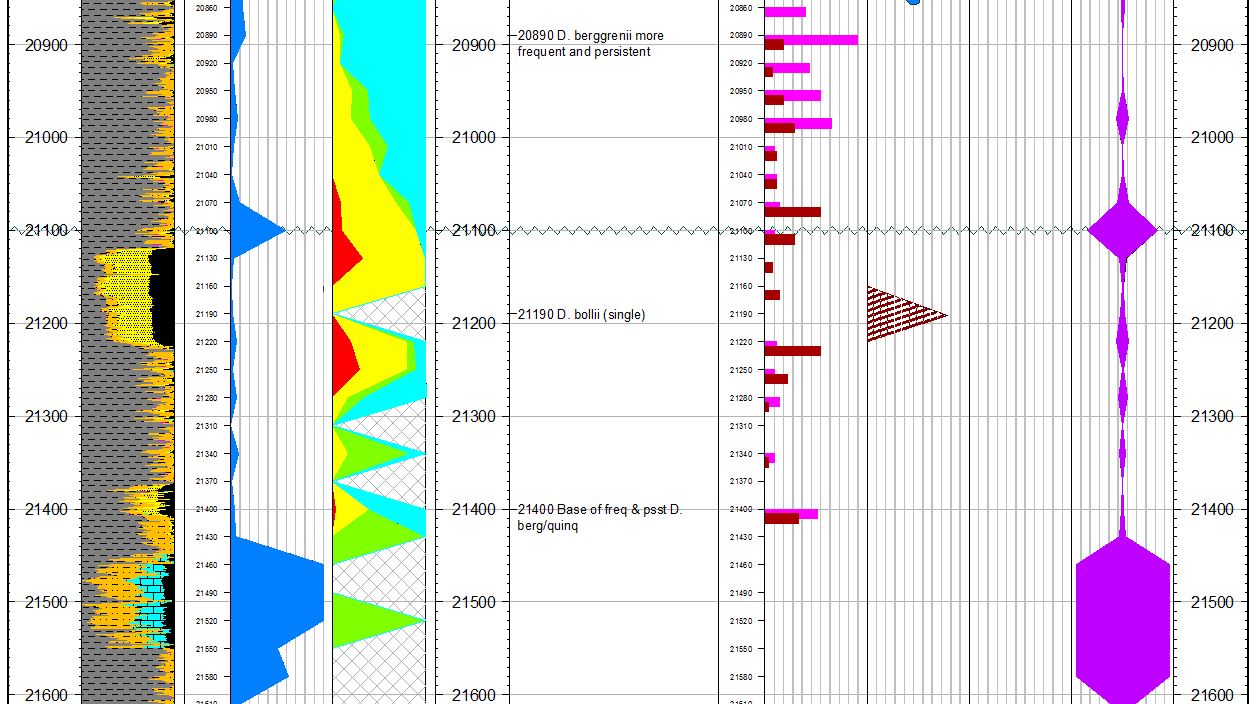
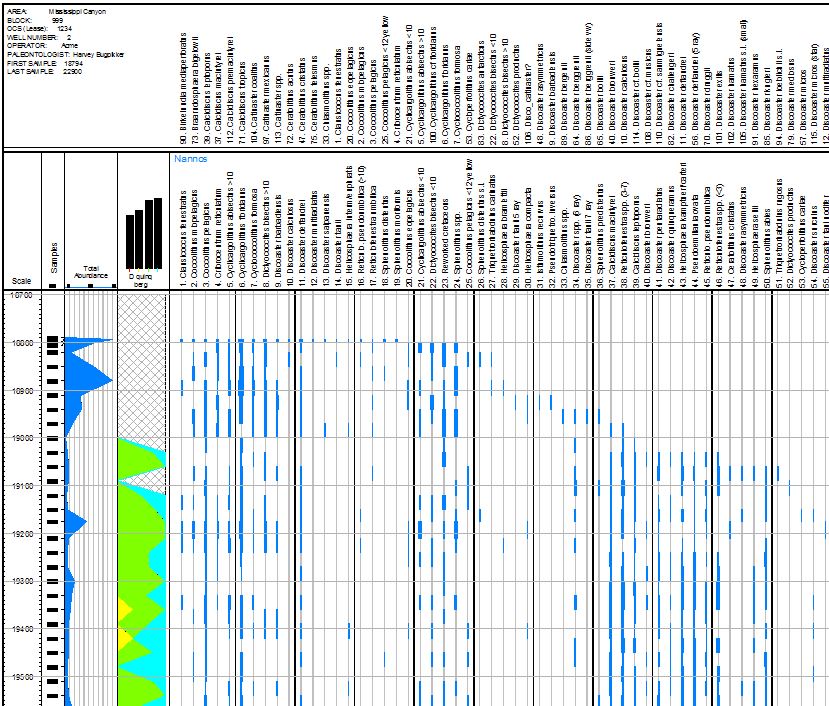 | Typical Distribution Chart Optional alphabetical listing, user defined colors.
| |
 | Logs and Casing Points This is an example of two e-logs and a casing point. User defined colors, line thickness, scale, etc.
| |
 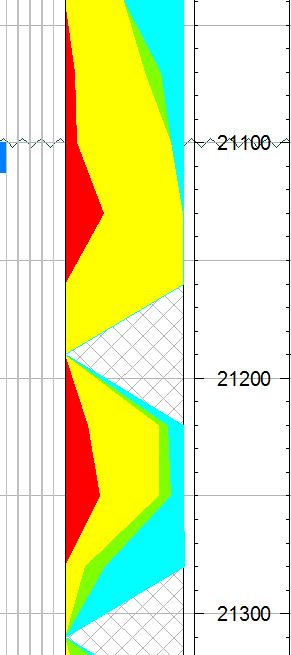 |
Compact Multiple Taxon Column The Compact Multiple Column feature plots multiple taxa as percentages relative to each other. When plotted with multiple wells, this could potentially show patterns of assemblages that were previously unrecognized. | |
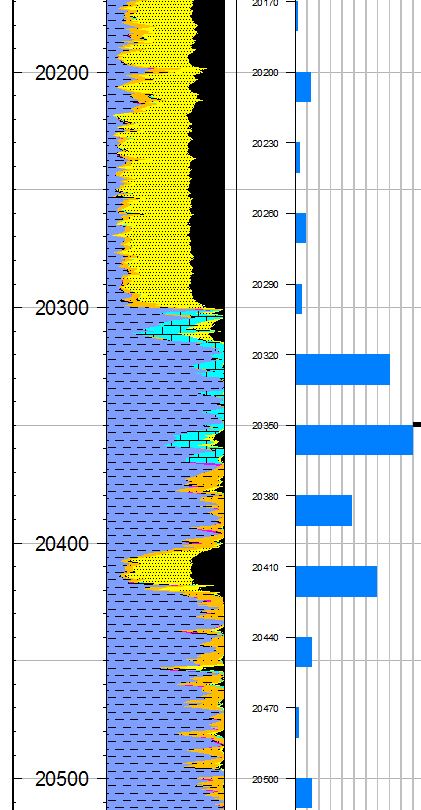 | Graphical Lithology example BugCAD can plot nice graphical lithology like the example shown. The source file can be either a BugWin generated file or the industry standard LAS format. Many hatch patterns are included with BugCAD, but you can also add your own .PAT files from other sources. | |
 | BugCAD multi-well capability This is a typical example of a mult-well project. Our BugWare biostrat scheme is on the far left, and the wells are tied in to it. Once set up, the drawing is automatically created, but can be completely annotated after it is drawn. | |